
Turning Chance into Certainty#
Earlier this year, I was attempting to convince my friends that they should invest their savings. And after trying my best to gather all the possible evidence to show that investing was indeed safe and effective, they (you know who you are) would not budge.
Even after this defeat, I still continued my quest. After all, I should be able to convince myself that investing was a reasonable risk. But after looking at historical performances, distributions, variances, expected values, means, medians, and modes, I began to wonder - do I even know what to make of it all?
Who is to say what bets should or should not be taken? Intuitively we know to avoid taking bets that are not in our favour (i.e. less than a 50% chance of a good outcome), but what about everything beyond that? Let’s imagine a game where you have a 60% chance of gaining $10, with a 40% chance of losing $10. If I offered this game to you, would you take it? now that the odds are in your favour?
What if the game was altered, where you would now gain/lose $100? or even $1000? What if the chances were changed to 70:30, 80:20, or 90:10? What if the winning and losing amounts were different? Suddenly our problem has become much more complex.
Reducing any arbitrary probability distribution into a boolean result - yes or no - seemed a lot harder than originally thought. Any attempt at some exotic combination of metric conditions always seemed to have some exemption.
But finally I found an answer. A concrete system which collapses these factors indiscriminately into a yes or no answer. Let me start at the beginning.
Setting a certainty threshold#
Nothing in life is certain. Because of this, we first need to establish a ‘certainty’ threshold. Rather than settling on some arbitrary figure like the conventional 95% or 99%, I have a slightly different approach.
A life table shows the probability of someone at x age dying in the next year. I propose that we set our ‘certainty’ threshold equivalent to the probability of living to see the outcome. In my case as a 22 year-old male, by looking at the life table I can find that my probability of death within one year is 0.1605%, or in other words, my probability of living is 1 - 0.001605 = 99.8395%.
To go even further, we can approximate the probability of living to the next day:
With this, I can simply set my ‘certainty’ threshold to 99.99955992168278%. This means that I should only ever accept a bet if it will have a winning probability of 99.99955992168278%. This way I can rest assured knowing that if chance ever happens to be against me, I may as well have died before ever knowing.
But of course this is a ridiculous figure. If I followed this rule as gospel, I would live my life without ever taking any risk. Luckily, there’s a hidden method that we can use to improve our odds drastically.
Improving odds through attempts#
Betting can be deceiving. As above, most people would only look at the conventional metrics: means, medians, modes etc. I would instead say that it is much more important to look at our number of chances (the number of attempts).
If I offered you that original 60:40 bet, there is a decent chance that you would lose money on your first try, however, if you played again and again, you would find that your results would improve. This is because over a long period of time, randomness begins to regress into certainty.
To explain what I mean, let’s see what this looks like in practice. First I will simulate 1000 people lined up in a queue. They each pay $10 to spin a wheel where they have a 60% chance of winning $20 back. I.e. 60% chance to win $10, 40% chance to lose $10.
I will then display a distribution of their outcome, as well as categorise them into ‘Winners’ or ‘Losers’, depending on whether they gained or lost money overall.
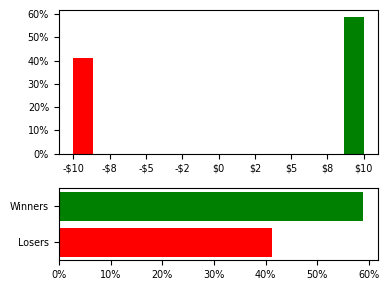
As one would expect, roughly 60% of our players were winners, and 40% were losers. Big whoop, why is this interesting? Well let’s see what happens when players are given 10 successive attempts at the game.
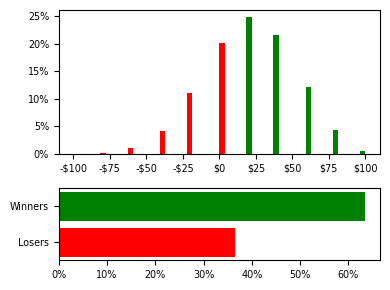
Suddenly our distribution looks a lot more interesting. And when reducing our results into winners and losers, we can see we have a subtle improvement in our number of winners. What about if our players were given 100 attempts at the game?
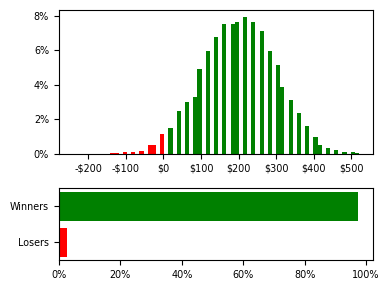
Now our players have a staggering 97% of winning. So what has happened? If we graph out the probability of being a ‘winner’, given the amount of attempts, we can see a clear trend.
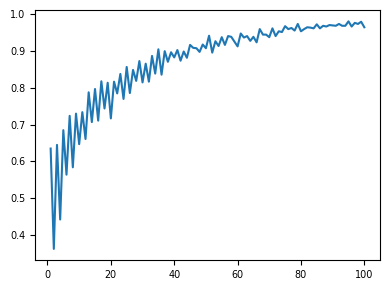
Seemingly, the higher number of attempts players are given, the higher proportion of overall winners. But why is this the case?
Exploring why odds improve with attempts#
First we need to step away from simulations, and instead delve into the mathematics.
As you can recall, an individual game looks like this:
We can then represent our total outcome like so:
Where:
T: total
w: number of wins
l: number of losses
a: number of attempts
In our example, lets set \(\text{a} = 10\).
Now, to be classed as a ‘winner’, the total will need to be greater than the money lost:
What you might notice is that we can solve the second equation by substituting the first (callback to highschool math).
Now we know we need to get less than 5 losses (i.e. 4 losses at most) to be considered a ‘winner’. The great thing about this discovery is that we can use it to calculate the exact probability of this occuring.
This can be done by using the binomial cumulative distribution function. The function accepts 3 values:
k: number of successes
n: number of trials
p: probability of success
Don’t be confused by the terminology of ‘successes’. Here it simply means the outcome we are inspecting. So these values then correspond to the following:
k: maximum number of losses to still win
n: number of attempts
p: probability of a loss
So we if wanted to calculate the probability of winning with 10 attempts at the game, we would run stats.binom.cdf(k=4, n=10, p=0.4).
To be sure, let’s graph out this new-found function and check if it is in line with our prior simulations:
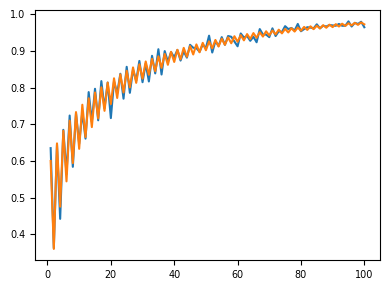
Seems like our math has paid off. Now we have a formal way in tracking how our probability of being a winner improves, given the number of attempts.
Plotting when chance crosses into certainty#
Now, remember when we calculated our ‘certainty’ threshold? Let’s see how many attempts it would take for our probability of winning to cross over into certainty:
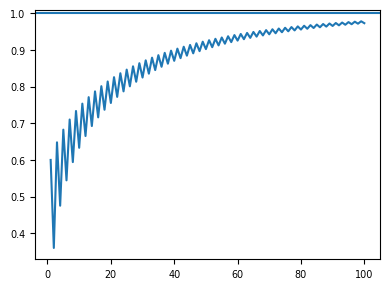
So it seems 100 attempts isn’t quite enough. Perhaps we’ll fare better with 1000 attempts?
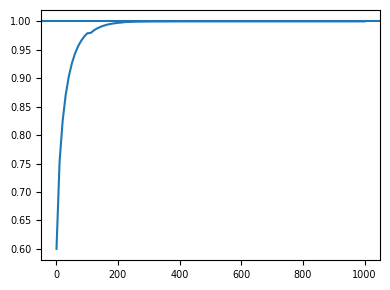
Hmm, a bit hard to read. Perhaps I’ll need to skew the y axis a bit?
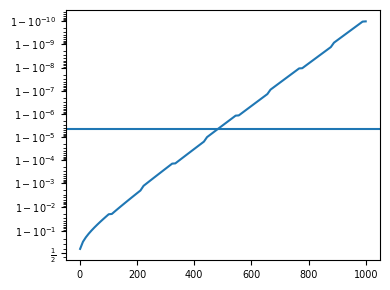
Much better. And there we have it! From our original 60:40 win/lose $10 game, it would seem that we should only participate in the game on the condition that we can have ~500 attempts, as by then - and only then - are we certain to be winners.